Azure Sentinel honeypot
An exposed Windows VM took 3,516 failed RDP logons from 8 countries in 24 hours, 3,106 of them from a single Indonesian IP.
- Date
- Stack
- Azure, Microsoft Sentinel, Log Analytics, Azure Monitor Agent, KQL
The finding
Within 24 hours of putting a Windows Server VM on the public internet with RDP open, Sentinel had recorded 3,516 failed logons. One IP address in Indonesia was responsible for 3,106 of them.
Context
I wanted to see what unsolicited traffic looks like against a machine nobody has been told about, and to practice the full path from a raw Windows security event to a Sentinel workbook without any middleware in between.
What was built
- A Windows Server 2025 VM in Azure with every inbound network security group rule open and the Windows firewall disabled, so RDP on port 3389 was reachable from anywhere.
- The Azure Monitor Agent, installed through a data collection rule, streaming Windows security events into a Log Analytics workspace.
- Microsoft Sentinel on that workspace.
- A workbook that enriches each attacker IP with country, city, latitude and longitude using
the built-in
geo_info_from_ip_address()function, then plots attempts on a map and ranks them by country.
Evidence
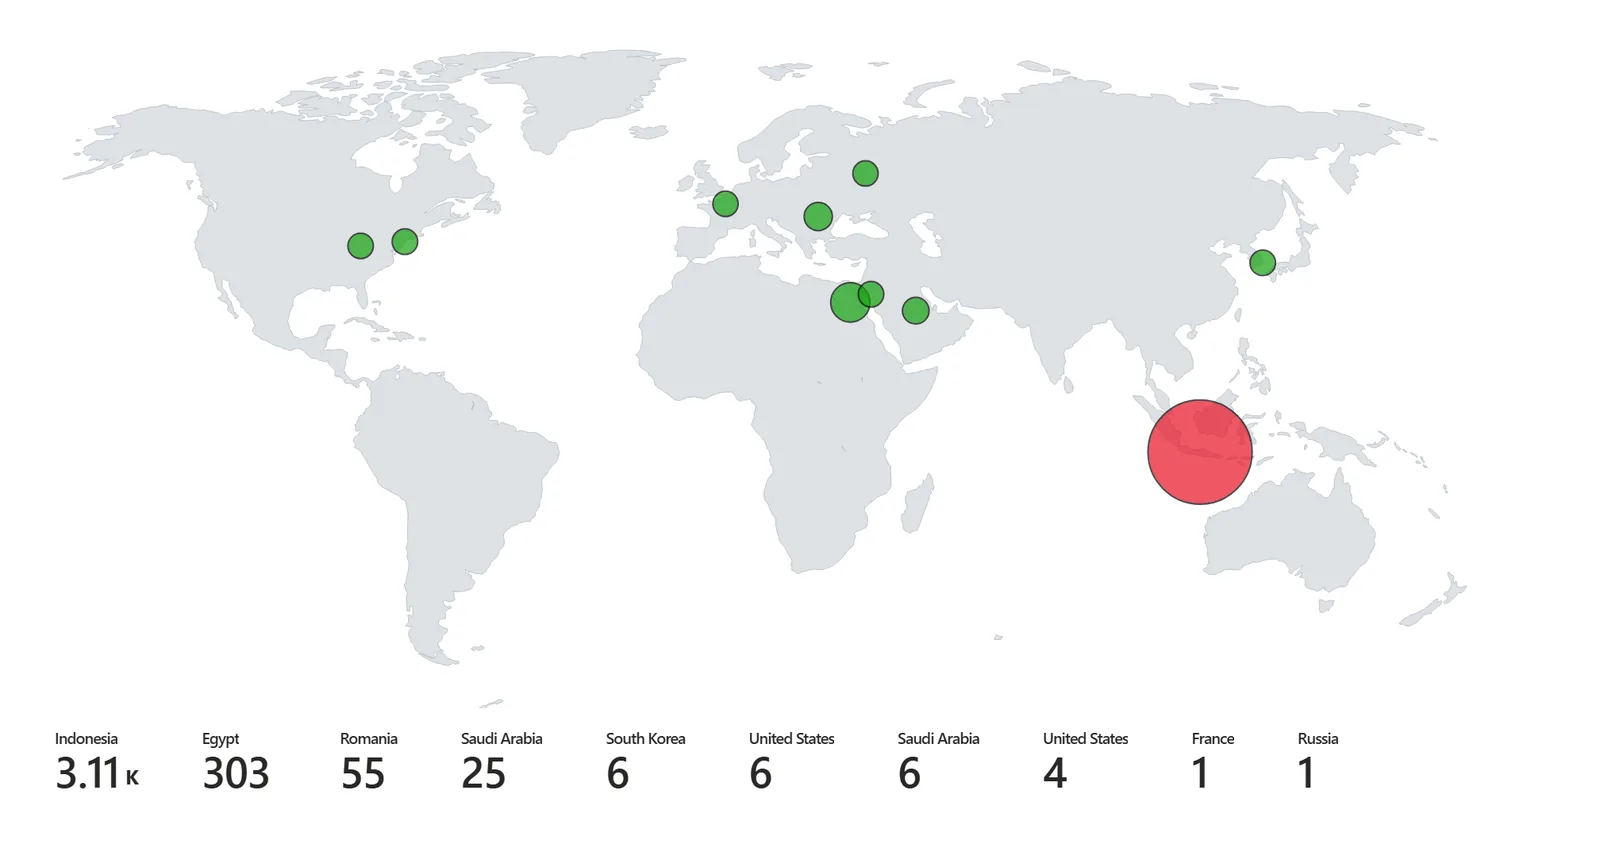
Failed logons (event 4625) by country over the first 24 hours:
| Country | Attempts |
|---|---|
| Indonesia | 3,106 |
| Egypt | 303 |
| Romania | 55 |
| Saudi Arabia | 31 |
| United States | 13 |
| South Korea | 6 |
| France | 1 |
| Russia | 1 |
The map query:
SecurityEvent
| where EventID == 4625
| where isnotempty(IpAddress)
| extend geoInfo = geo_info_from_ip_address(IpAddress)
| extend Country = tostring(geoInfo.country)
| extend Latitude = todouble(geoInfo.latitude)
| extend Longitude = todouble(geoInfo.longitude)
| extend City = tostring(geoInfo.city)
| summarize AttackCount = count() by Country, City, Latitude, Longitude, IpAddress
Top source addresses:
SecurityEvent
| where EventID == 4625
| where isnotempty(IpAddress)
| extend Country = tostring(geo_info_from_ip_address(IpAddress).country)
| where isnotempty(Country)
| summarize Attacks = count() by IpAddress, Country
| sort by Attacks desc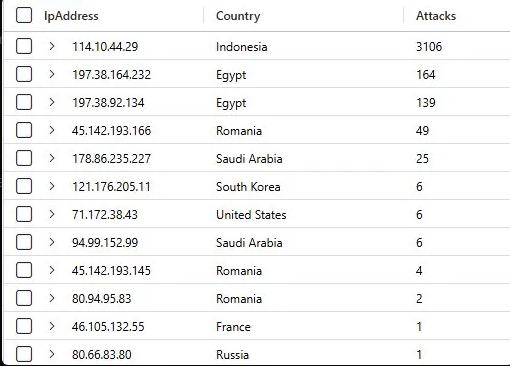
I also kept a query running for the thing I did not want to see: a successful logon (event 4624) over the network or RDP from a public address.
SecurityEvent
| where EventID == 4624
| where LogonType in (3, 10)
| where IpAddress != "-"
| where IpAddress !startswith "10."
| where IpAddress !startswith "172."
| where IpAddress !startswith "192.168."
| where IpAddress != "127.0.0.1"
| where Account !contains "SYSTEM"
| where Account !contains "LOCAL SERVICE"
| where Account !contains "NETWORK SERVICE"
| where Account !contains "$"
| where Account != "NT AUTHORITY\\ANONYMOUS LOGON"
| project TimeGenerated, Account, IpAddress, LogonType, Computer
| order by TimeGenerated desc
It returned nothing during the run.
What it means
- Automated brute force starts within minutes of a public IP appearing, not days.
- The volume is dominated by a few sources. One address did 88% of the work, so per-IP lockout or rate limiting would have removed most of the noise, while country blocking would have missed the long tail.
geo_info_from_ip_address()is enough for enrichment at this scale. No external API, no function app, no cost beyond ingestion.- A workbook is a short path from raw events to something a non-analyst can read.